
Glacial ice is in constant motion, moving at rates of cms, meters or even kms a year (inches, feet, miles). Scientists measure ice flow as velocity which includes both the speed of ice flow and direction of movement. It is important to monitor the velocity of ice flow in Antarctica to determine the rate and amount of ice being added into the ocean which contributes to sea level rise. Thwaites glacier has been flowing at a rapid rate for many years, moving ice into the Amundsen with a net loss of more than 1000 billion tons of ice since 2000.
1640.42 feet
both vertically and horizontally
land
9842.52 feet
the place around the perimeter of the ice sheet where the ice starts to float
~20 feet
~180 feet
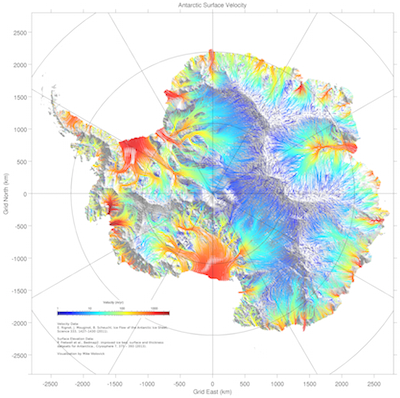
Antarctica Flow Trajectories. (Image credit: M. Wolovic, LDEO)
What is Velocity? Although it may appear stationary, glacial ice is constantly moving, flowing downslope under its own weight through the pull of gravity. The velocity of the ice refers to how quickly it moves its position and includes both speed and direction. Ice movement is controlled by physics and the difference in driving and resistive forces. The 'driving force' in glaciers is gravity, which increases and causes the ice to flow faster, with steeper surface slopes and thicker ice. The 'resistive force' is mainly from friction between the ice and the rock it moves over. Friction, from narrow channels along the sides and rough bedrock below, will decrease glacier speed. Temperature is another major factor in the speed of a glacier. A warmer temperate glacier has a wet base that acts as a lubricant increasing glacial sliding and velocity. A cold based glacier on the other hand, is frozen at its base which increases friction and reduces ice speeds.
How do we measure it? Scientist use many techniques to determine the speed of the ice surface. Early measurements were collected by physically placing stakes in the ice and manually tracking their movement through time. Other techniques include aerial photographic differencing, or comparing two aerial photographs taken at different times, and using high-precision GPS receivers to show location changes. Some of the best spatial coverage of ice surface velocity comes from satellite measurements, using a technique called 'Interferometric Synthetic Aperture Radar (InSAR)'. InSAR can provide monthly ice surface velocity data at 500 m horizontal resolution.
The digital mosaic image of Antarctic ice flow speed in the app and on this page, is pieced together from multiple InSAR data collected from 2007-2009 during an international science effort called the International Polar Year. The data image was complied by E. Rignot et al., and has been illustrated by M. Wolovick. Similar to radar used in weather monitoring and in traffic enforcement, satellites bounce electromagnetic energy off the Earth’s surface, timing its travel. The distance to the reflecting surface can be calculated by knowing the speed of light in the transmitting medium and the signal delay. By comparing data collected from different times, scientists can determine velocity by measuring how much locations on the ice surface have moved. However, these techniques can only measure the velocity of the ice surface and ice does not move evenly from the surface to the base. Recall that the base of the ice moves more slowly due to friction (resistive force) between the ice and the bed beneath.
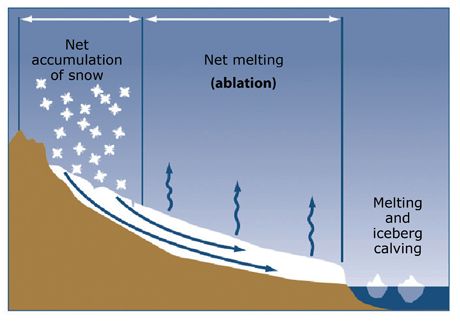
A cartoon of the mass balance of a glacier. (Image credit: AntarcticGlaciers.org)
What can we learn from the app? Explore Antarctica using the app. The blue areas in the interior of the East Antarctic Ice Sheet are flowing slowly, many of them just a meter (~3 feet) a year. These slow areas are primarily near ice divides, areas where ice flows in different directions, and in the center or summit of the ice sheet. At the summit temperatures are very cold, and the ice surface is vast and flat, with very low surface slope meaning there is very little driving stress to cause the ice to accelerate. The red and yellow colors show the fastest moving ice. These areas are concentrated around specific areas, mainly around the coast, in ice streams, and the ice shelves. Deep channels under the glaciers increase driving stress and reduce friction under the ice shelves, resulting in fast flowing ice. To understand more about this see the map you might want to look at 'Look under the Antarctic Ice Sheet' in this section.
A permanent layer of land ice at least 50,000 sq. km. (20,000 sq. miles).
bands of fast flow within an ice sheet
floating edges of the ice sheet where it has flowed off into the ocean yet continues to hug the land
More explorations? For this next part we suggest you turn off the 'ITGC Projects' layer up on the left side of the map under the +/- symbols for expanding and shrinking the map. On the West Antarctic coast the two glaciers showing the fastest moving Antarctic ice are Thwaites Glaciers and neighboring Pine Island Glacier. Both flow into the Amundsen Sea. See how each of these is flowing at rates over 3000 m/year at their 'grounding line'. Glacier velocities change over both long and short timescales. Although the map data in the Thwaites Explorer App is a composite that is representative of 2007-2009, Thwaites glacier continues to flow at rapid rates moving ice into the Amundsen with a net loss of more than 1000 billion tons of ice since 2000. Zoom out on the map and compare the speeds of other fast flowing areas to the Thwaites and Pine Island Glaciers. What did you find? Do you think Thwaites is an area where we should be focusing our attention? Why?
What about the Future? A rise in atmospheric and oceanic temperatures around Antarctica will act to increase the speed of the Antarctica ice sheet by several different mechanisms. To learn more about what is happening in the ocean around Thwaites Glacier, check the map in this section labeled 'Ocean Temperatures at 550m'. Increased ocean temperature will increase melt at the base of marine terminating glaciers that empty into the ocean. Ocean water moves under the floating 'ice tongues' of these marine glaciers and attacks them where they are frozen to the land below (called the 'grounding line'). Increased melting from ocean warming also weakens the ice shelves around Antarctica including the Thwaites ice shelf, and can cause them to calve and ultimately collapse. Ice shelves act like a gate to slow and hold the ice flowing onto the shelf from the glaciers. As ice shelves collapse, glacial ice accelerates moving more ice off the land and into the ocean. We have seen this occur along the Eastern side of the West Antarctic Peninsula with the Larsen ice shelves 'A' (1995) and 'B' (2002).
long narrow section of ice projecting out from the coastline that forms when section of ice moves very rapidly out into the ocean
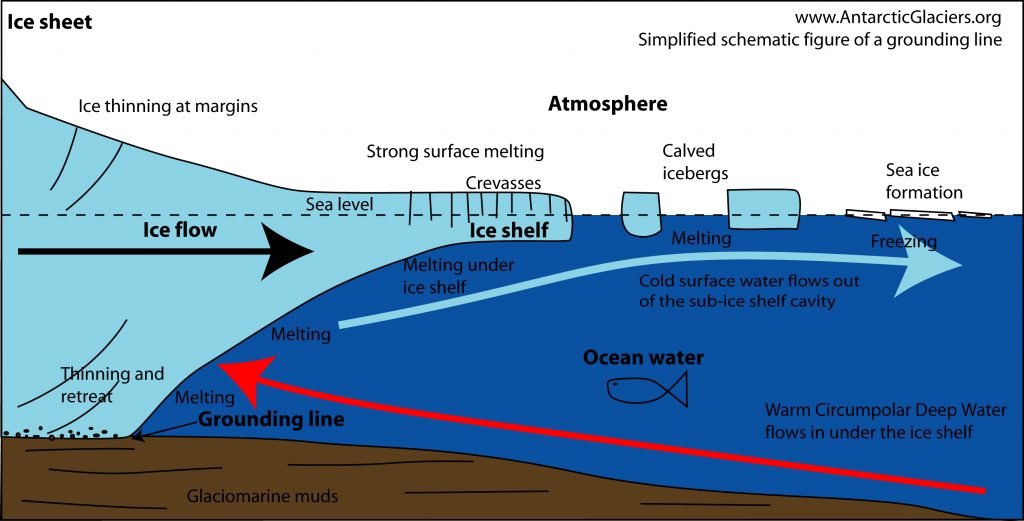
A cartoon version of an ice sheet grounding line leading into an ice shelf. (Image credit: AntarcticGlaciers.org)
Melting back the grounding line will decrease resistance to flow and increase ice discharge. Faster ice flowing into the ocean, without an increase in snow accumulation high up on the ice sheet, results in more water in the oceans, raising global sea level. Thwaites is currently losing about 50 billion tons of ice per year into the ocean more than it is receiving in snowfall. With ~6 m of potential global sea level rise in the West Antarctic ice sheet, and another ~55 m in the more stable East Antarctic ice sheet, monitoring Antarctic ice velocity is critically important.
Data Source
Additional information